xarray & the Data Cube
Goal: Model multi-dimensional rasters as labeled arrays with xarray: dimensions (e.g. time, band, y, x), coordinates, and attributes.
The data cube concept
A data cube (or raster data cube) is a multi-dimensional array where dimensions typically include:
- Spatial:
y,x(or lat/lon) - Temporal:
time - Thematic:
band,variable, orlayer
Conceptually:
In this course xarray represents this model: dimensions and coordinates are labeled, so selection is by name (e.g. time, band) instead of axis index. That makes code readable and less error-prone when combining multiple scenes or variables.
From a STAC stack to a data cube
A single-band 2D raster is just a 2D array. Several Sentinel-2 scenes, each with red/NIR (and other) bands, form a stack. xarray holds that stack as:
- Dimensions: named axes (e.g.
time,band,y,x). - Coordinates: labels along each axis (dates, band names, projected x/y).
- Data variables: arrays that depend on those dimensions (
B04,B08,ndvi). - Attributes: metadata (CRS, units).
The lesson notebook builds this cube with rioxarray.open_rasterio + xr.concat(..., dim="time") over northern Karnataka — not with hand-made NumPy arrays.
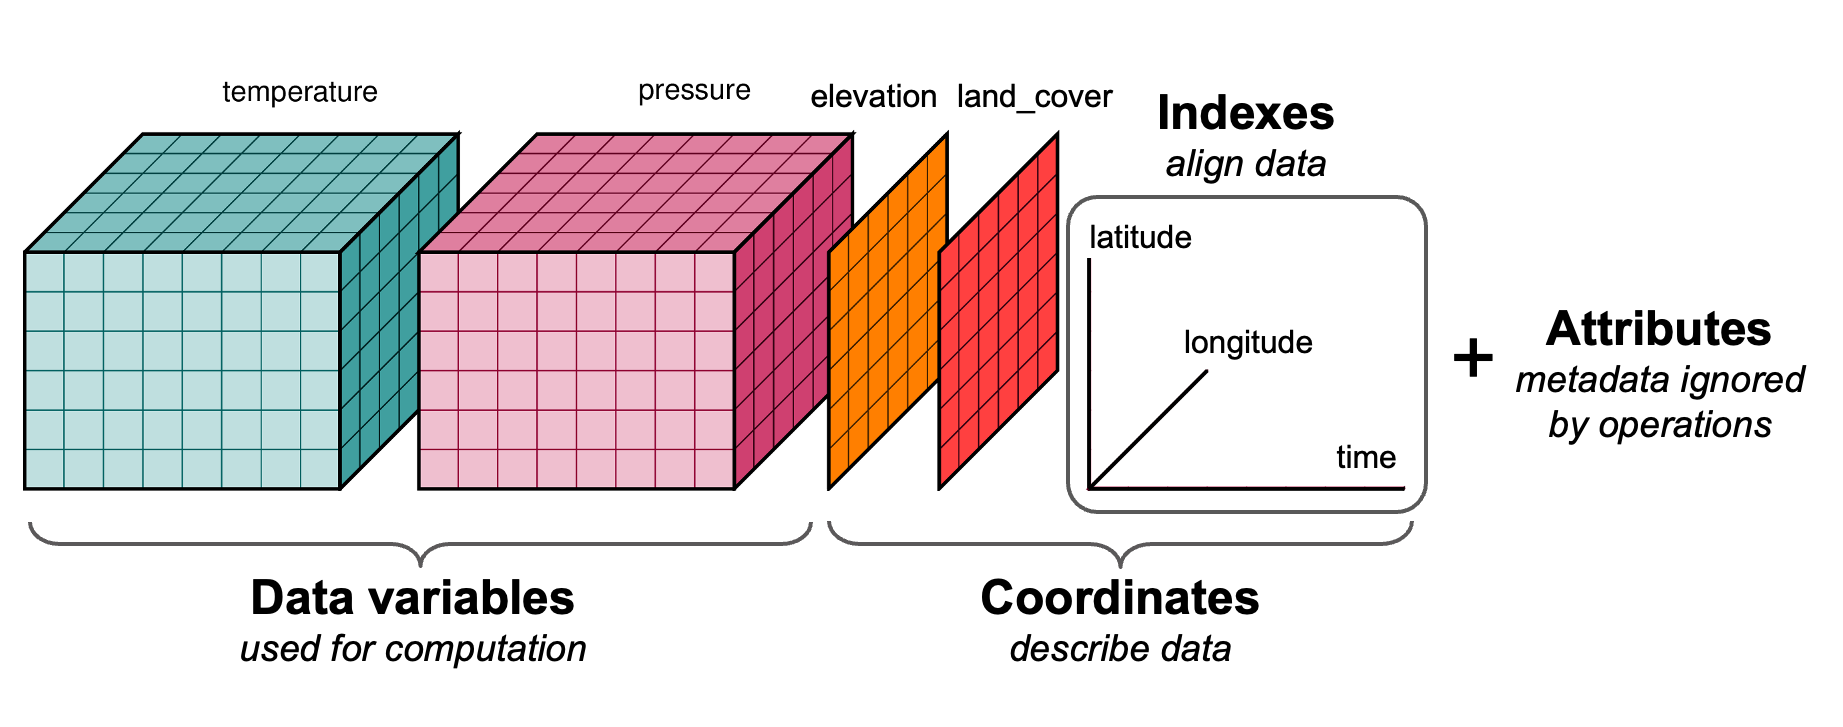 Source: Stephan Hoyer, ECMWF presentation.
Link to original talk
Core structures
DataArray and Dataset
A DataArray is one labeled array (e.g. stack["B04"]). A Dataset is several DataArrays that share dimensions (B02, B03, B04, B08, then ndvi).
stack = xr.concat(scenes, dim="time")          # Dataset: time, y, x
cube = stack.to_array(dim="band")              # DataArray: band, time, y, x
red = stack["B04"].isel(time=0)
stack["ndvi"] = (stack["B08"] - stack["B04"]) / (stack["B08"] + stack["B04"])
Why labels matter
With NumPy, indexing is arr[i, j] or arr[0:10, :] and the meaning of each axis must be remembered. With xarray:
stack.isel(time=0)
stack["B04"].sel(time=t0)
stack.isel(time=slice(0, 3))
ts = stack["ndvi"].mean(dim=["y", "x"])
That makes code readable and less error-prone when combining multiple scenes or variables.
Dimensions typical in raster cubes
| Dimension | Meaning | Example coordinates |
|---|---|---|
x |
Horizontal (easting / lon) | Projected x or longitude |
y |
Vertical (northing / lat) | Projected y or latitude |
band |
Spectral/thematic layer | ["red", "green", "blue", "nir"] |
time |
Time step | datetime64 dates |
So a multi-temporal, multi-band stack might have shape (time, band, y, x).
Lazy vs eager
xarray can wrap Dask arrays instead of NumPy. Then the array is lazy: operations build a task graph; actual reads and compute happen on .compute() or when plotting is triggered. This is used in Lesson 4 for scalable analytics; in Lesson 3 COGs are opened as xarray (with rioxarray) and can be lazy by default.
Summary
| Concept | Detail |
|---|---|
| Data cube | Multi-dimensional raster with labeled dimensions (time, band, y, x) |
| DataArray | Single array + dims + coords + attrs |
| Dataset | Multiple DataArrays sharing dimensions |
| Selection | .sel() by coordinate, .isel() by index, .slice() |
| Lazy | xarray can hold Dask arrays; compute on demand |
In next lesson we use rioxarray to open COGs as xarray objects with CRS and spatial coordinates.
Download the notebook for this lesson: notebooks/02-xarray-datacube.ipynb.